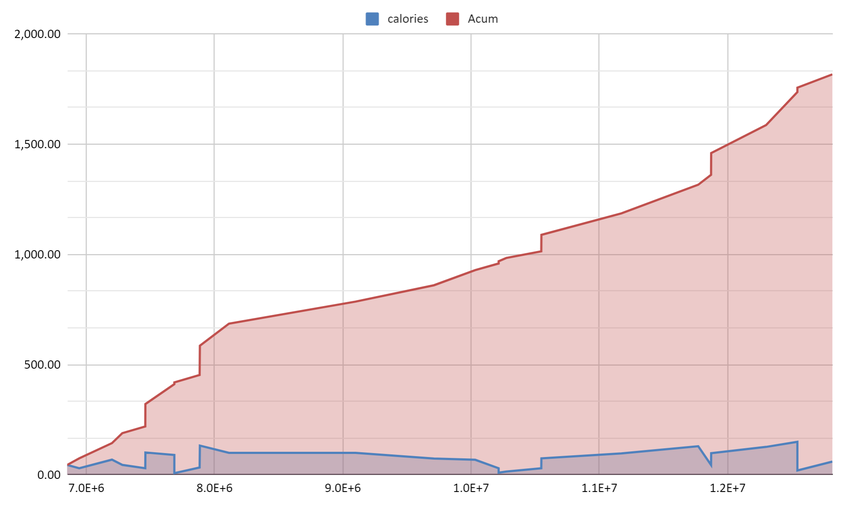
I have a bot where you can register your exercise routines. So now I have a few months of data, and I’d like to do something with it.
I think the gamified contribution graph from Github could be something interesting (to see how often you exercise and how intense it was)
Currently, I have this graph of burned calories each day and a sum, over a timeline, but I think it does communicate anything interesting:

Any ideas?