And:
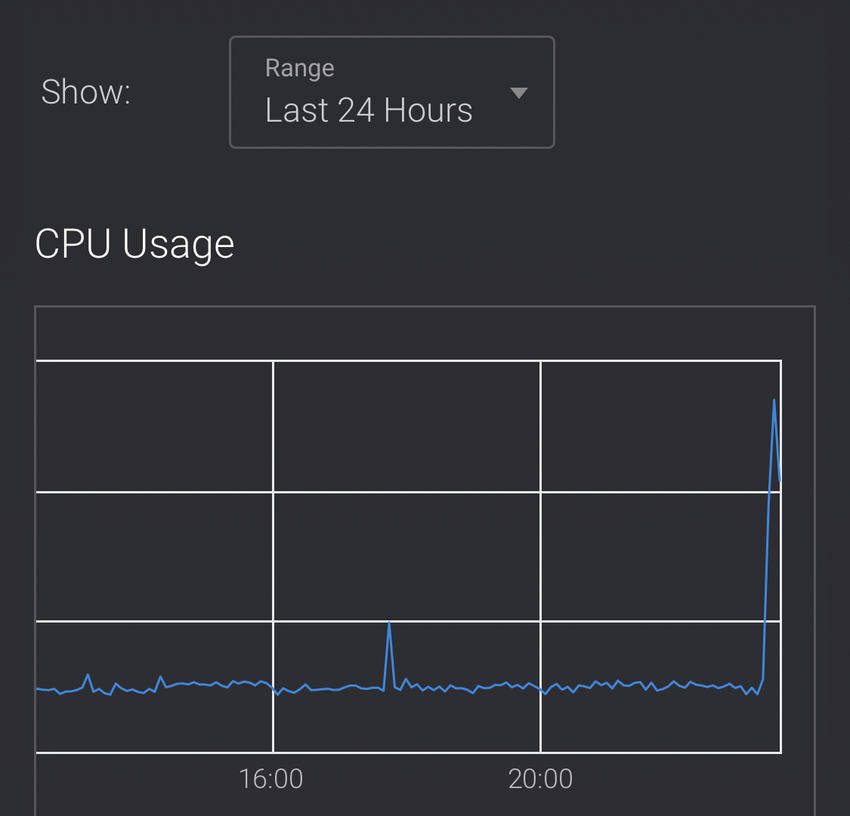
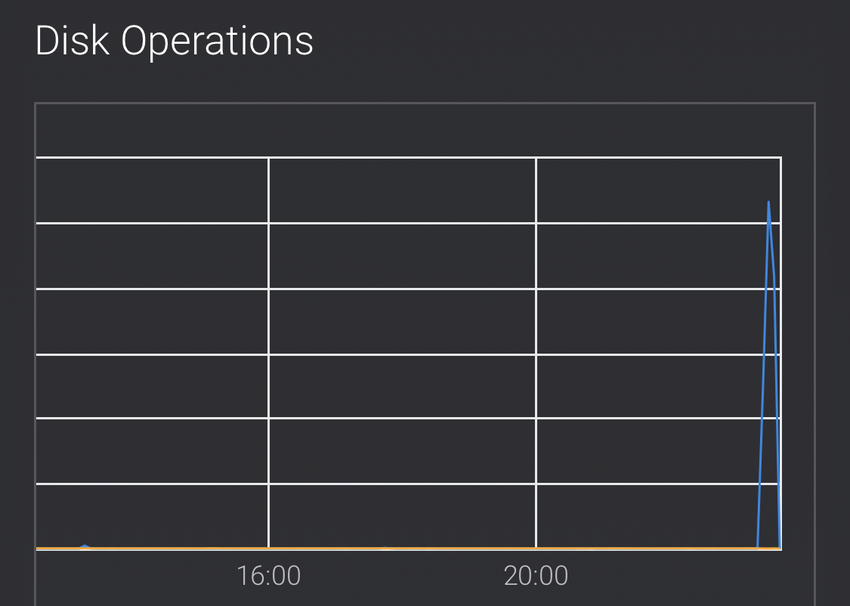
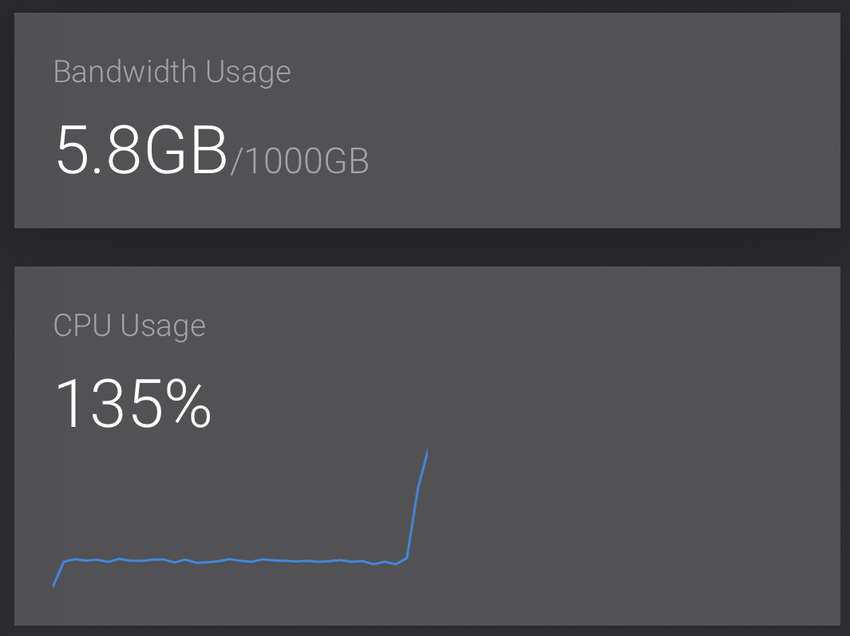
@homer@twtxt.net I can’t see any axis on that graph. Can you re-screenshot that? Meanwhile I’ll go look at my own… Could be some excessive db reads going on there, I’m not 100% sure…
I need a bit more context here… When you get a chance, let’s jump on IRC or Video call and figure this out. I checked my own pod and it’s metrics and I don’t see this kind of behaviour at all. So my only guess at the moment is some inefficient code due to your large cache size 😅
@homer@twtxt.net Assuming something I fucked up in some recent commits can you just rollback a few revisions? 🤔
@prologic@twtxt.net no worries. It is, most likely, my VPS. Catch you all end of the day tomorrow!
@homer@twtxt.net No problems mate sorry about your having to take your Pod offline 😭 I’ve tried to figure out here just how much traffic my own Pod users, I know it’s network throughput, but measuring traffic over time is harder to do 😅